What is profiling?
Profiling is an essential technique for analyzing applications and identifying bottlenecks hindering the application’s performance. It is helpful to detect which parts of the code are taking too long to execute or consuming too many resources, such as CPU and memory.
Table of Contents
- Benchmarking
- Profiling CPU
- Profiling Memory - Runtime profiling
- Profiling CPU
- Profiling Memory - Web profiling
- Getting CPU Profile and tricks
- Getting Heap Profile and tricks
- Getting Allocation Profile and tricks
Methods of Profiling
You have three methods for profiling.
- Go test (with benchmarking).
- Runtime profiling with runtime/pprof.
- Web profiling with net/http/pprof.
Types of Profiling
- CPU (collects data on the application CPU usage)
- Heap / Memory (collects data on application memory usage)
- Goroutine (identifying the functions that create the most number of goroutines)
- Block (identifying the functions that cause the most blocking)
- Thread (identifying the functions that create the most threads)
- Mutex (identifying the functions that have the most contention)
In this article, I mainly focus on CPU and Memory profiling with the abovementioned methods.
1. Benchmarking
I wanted to implement the famous Two Sum algorithm problem. I don’t focus on the details about it. Let’s run
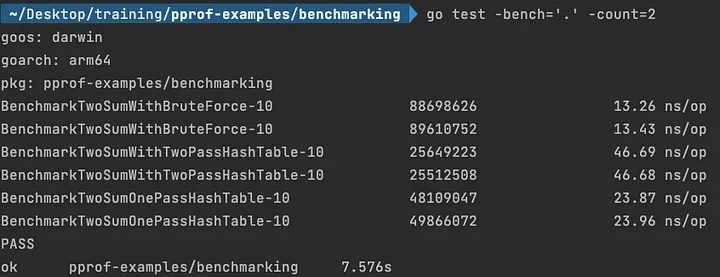
go test -bench=.
-bench option runs all of the benchmark tests in our project.

Based on the output above, TwoSumWithBruteForce is the most efficient one compared to others. Don’t forget that it depends on the function’s inputs. If you give a large array, you will get different results. 😅
If you type go help testflag , you will see lots of flags and their explanations. Like count, benchtime etc. I will explain the most used ones.
- If you want to run a specific function, you can specify it as
go test -bench='BenchmarkTwoSumWithBruteForce'
- By default, benchmark functions run only once; if you want to override this behavior, you can use
counta flag. For example,
go test -bench='.' -count=2
gives output as shown below.
- By default, Go decides how long each benchmarking operation runs. You can override this by providing.
benchtime='2s'.
You can use
countandbenchtimeflags together for better measurement of your benchmarked functions. You can also refer to this article.You can find source code here!
In the real world, our functions can be complex and long. The timing is not helpful here, so we need to extract the CPU and memory profile for further analysis. You can type
go test -bench='.' -cpuprofile='cpu.prof' -memprofile='mem.prof'
Let’s analyze them using the pprof tool.
1.1 Profiling CPU
If you type in
go tool pprof cpu.prof
and hit enter, you will have a pprof interactive console.

Let’s take a look at the most popular ones.
- You can type
top15to see the top 15 resource-intensive functions during the execution time. (15 indicates the number of nodes that will displayed.)
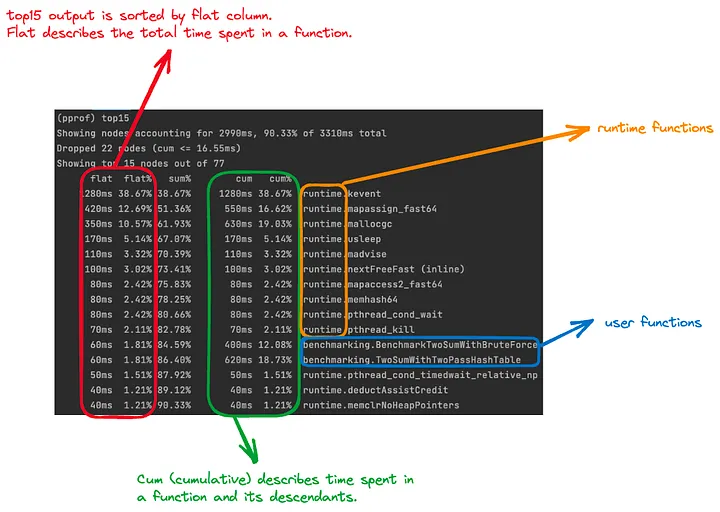
To be clear, let’s assume that we have a A function.
func A() {
B()             // takes 1s
   DO STH DIRECTLY // takes 4s
C()             // takes 6s
}
Flat and cumulative values are calculated as; A=4 for flat and A=11 for cum (1s + 4s + 6s).
- If you want to sort based on cum value, you can type
top15 -cum. You can also usesort=cumandtop15commands respectively. - If you want to get more verbose output in the
top, you can specifygranularityoption. For example, if we passgranularity=lines, it shows the lines of the functions.
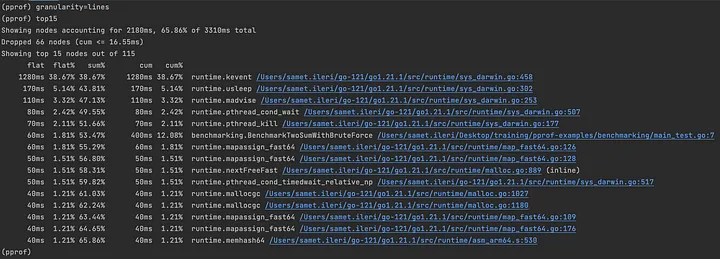
Thanks to this, we can identify specific lines of the function causing performance issues. 😌
- The output also shows us runtime and user-defined functions together. If you want to focus on only your functions, you can provide
hide=runtimeand executetop15again.

top15 with hide option
You can reset it by typing hide= .
- Conversely, you can use
showcommand. For example, by typingshow=TwoSum

- If you want to focus on a specific node, you can use
focuscommand. Let’s focus onTwoSumOnePassHashTable. The output is displayed as

top output with hide and focus together
You can reset it by typing focus= .
- If you want to get details of the function, you can use
listcommand. For example, I want to get details aboutTwoSumWithTwoPassHashTablefunction. Typelist TwoSumWithTwoPassHashTable
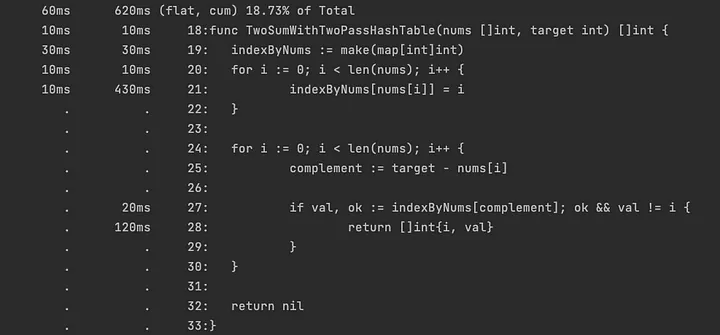
list TwoSumWithTwoPassHashTable output
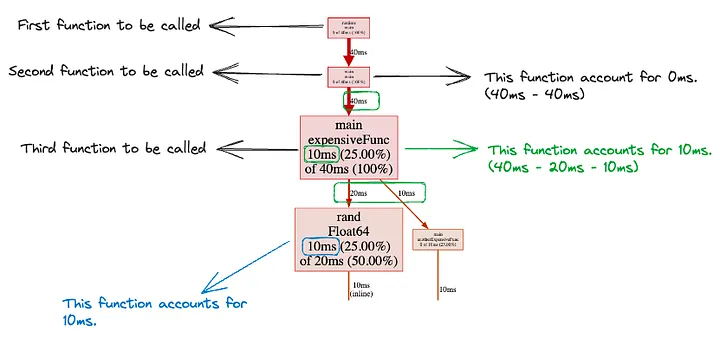
- If you want to see a graphical representation of the call stack, you can type
web.
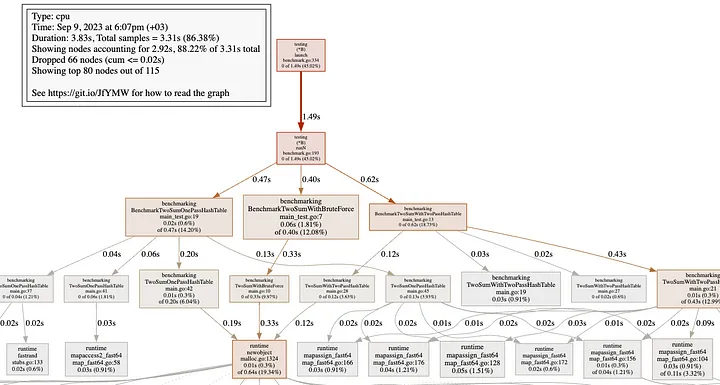
web output
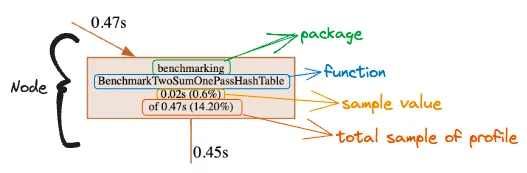
Node detail
I will give more details about reading the graphs in the following sections.
- You can also type
giforpdfto share profiling data in the corresponding format with someone. 😃
1.2 Profiling Memory
If you type in go tool pprof mem.prof and hit enter
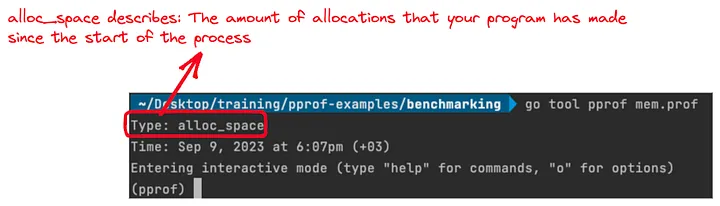
go tool pprof mem.prof output

top10 output
Note that flat and cum are the same thing mentioned above but only different measurements (ms in CPU, MB in Memory profiling).
- list command:
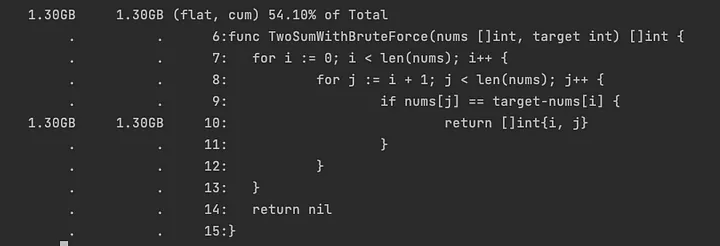
list TwoSumWithBruteForce output
- web command:
web command output
We can use all the commands mentioned in the CPU profiling section.
Let’s take a look at another method, runtime/pprof. 🚀
2- Runtime profiling with runtime/pprof.
Benchmark tests are useful for an isolated function’s performance but are insufficient to understand the whole picture. Here runtime/pprof shines 💠.
2.1 Profiling CPU
In benchmark tests, CPU and memory profiling are supported built-in. If you need to add CPU profiling support to your application, you must enable it first.
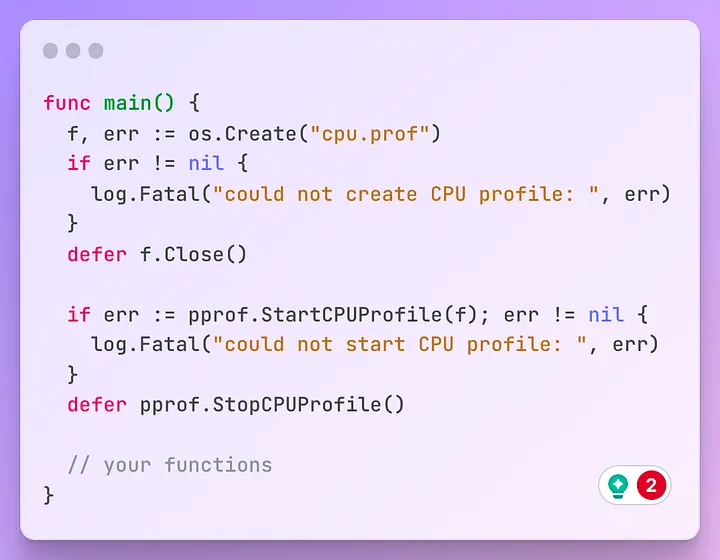
If you run go run . here, you will see the generated cpu.prof file. You can analyze it go tool pprof cpu.prof as mentioned in the benchmarking section.
In this section, I want to introduce to you one of my favorite features is pprof.Labels . This feature is available only on CPU and goroutine profiling.
If you want to add a label/labels to a specific function, you can use pprof.Do func.
pprof.Do(ctx, pprof.Labels("label-key", "label-value"), func(ctx context.Context) {
// execute labeled code
})
For example,

Adding a label to a specific function
In the pprof interactive console, type tags . It shows your labeled functions with useful information.

tags output
You can do lots of things with labels. You can get more information from this article.
pprof also has a great web interface. It allows us to analyze profiling data using various visualizations.
Type go tool pprof -http=:6060 cpu.prof , localhost:6060 will be opened. (To be more clear, I removed pprof.Labels)
Let’s dive into graph representation.
Graph for CPU analysis
Node color, font size, edge weight, and many more have different meanings. Please refer to it here. This visualization allows us to identify and fix performance issues more easily.
After clicking a node in the graph, you can refine it. It allows us to filter the visualization based on our choice. I showed some of the above (focus, hide, etc.).

Refine options
You can also see other visualization options.

View options
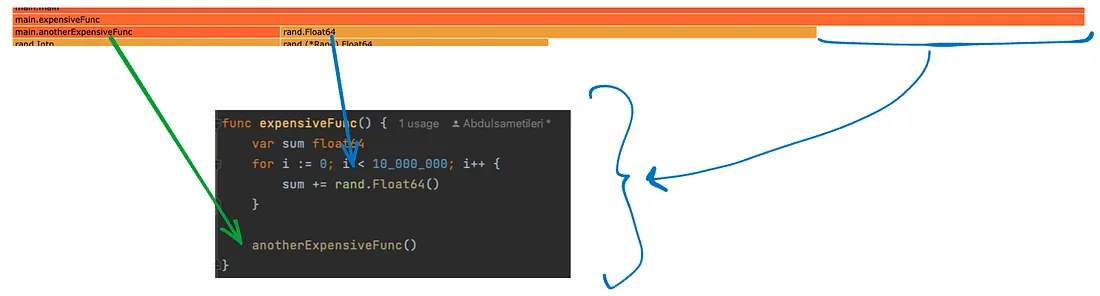
I showed peek and source (as the list command), so I want to introduce you to Flame Graph. Flame graphs provide a high-level view of where time is spent in your code.
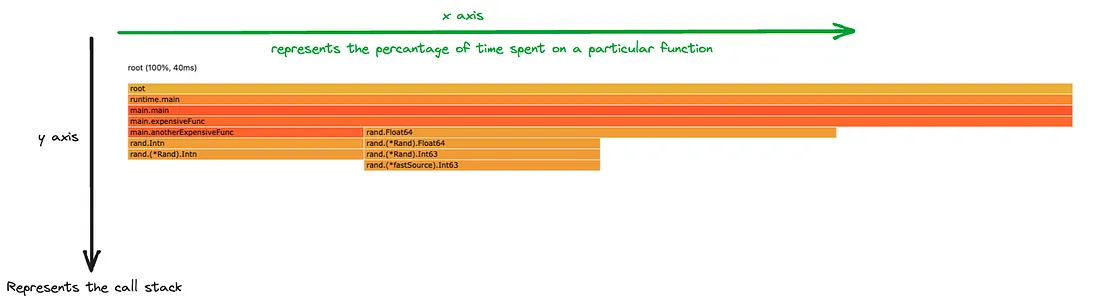
Each function is represented by a colored rectangle where the width of the rectangle is proportional to the amount of time spent in that function.
You can find the source code here!
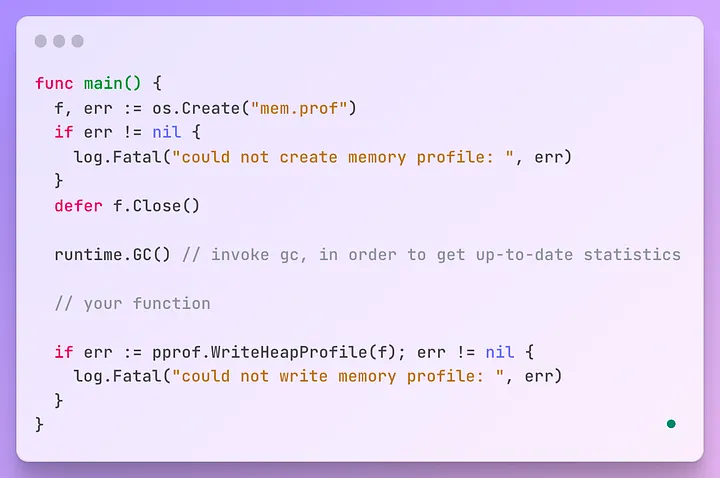
2.2 Profiling Memory
If you need to add memory profiling support to your application, you must enable it first.
You can find the source code here.
If you run go run . here, you will see the generated mem.prof file. You can analyze it go tool pprof mem.prof as mentioned in the benchmarking section.
I want to introduce to you two more useful commands tree and peek .
- The
treeshows all callers and callees of the execution flow.
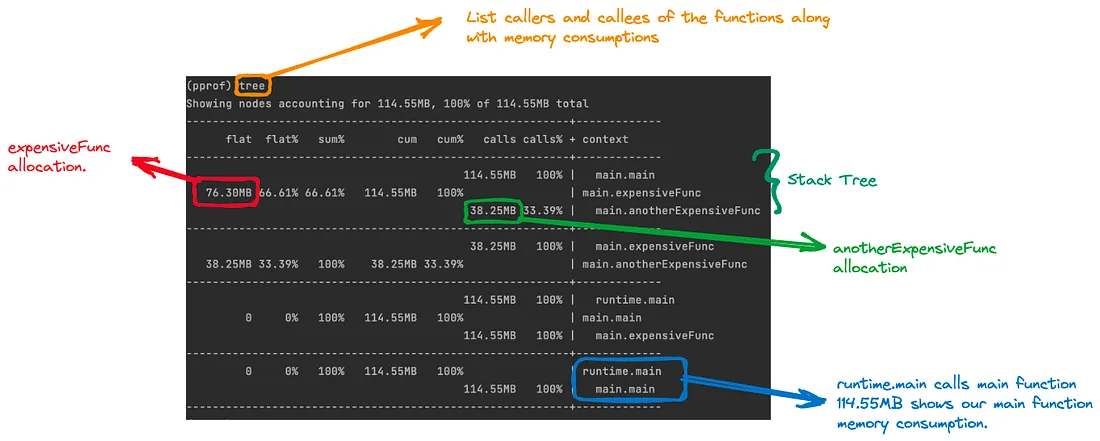
This allows us to identify the execution flow and spot the objects that consume the most memory. (Don’t forget to use granularity=lines It provides a more readable format.)
- If you want to see a specific function execution flow, you can use
peekcommand. For examplepeek expensiveFuncshows

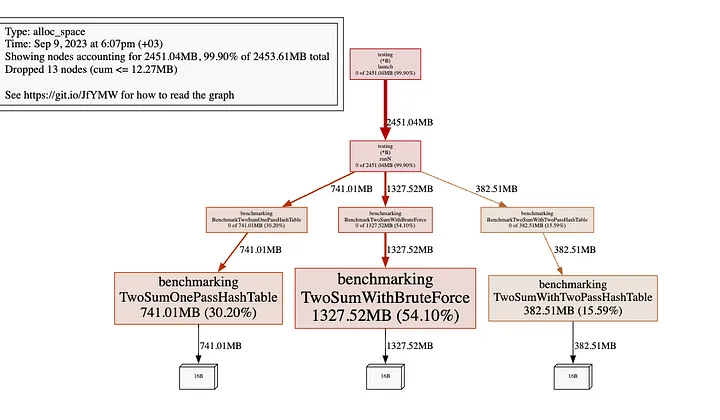
- You can also use the pprof web interface for memory analysis. Type
go tool pprof -http=:6060 mem.prof,localhost:6060will be opened.

Graph for memory analysis
You can find the source code here!
3. Web profiling with net/http/pprof
The runtime/pprof package offers a lower-level interface for our Go program’s performance. On the other hand, net/http/pprof provides a higher-level interface for profiling. It allows us to collect our program profiling information through HTTP 💃 All you can do is:
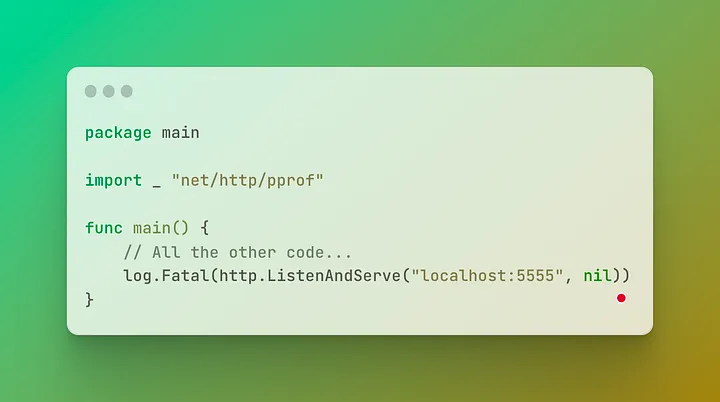
Adding net HTTP pprof
If you type localhost:5555/debug/pprof , you will see all available profiles on your browser if you are not using stdlib, check fiber, gin, or echo pprof implementations.

All other usages and parameters are documented here. Let’s review popular ones.
Getting CPU profile and Tricks
go tool pprof http://localhost:5555/debug/pprof/profile?seconds=30
During the CPU profiling, be aware
runtime.mallogc that → means you can optimize the number of small heap allocations.
syscall.Read or syscall.Write that → The application spends a significant amount of time in Kernel mode. You can try to do IO/buffering.
Getting Heap (a sampling of live objects’ memory allocations) profile and Tricks
go tool pprof http://localhost:5555/debug/pprof/heap
go tool pprof http://localhost:5555/debug/pprof/heap?gc=1
Personally, I loved playing with GC parameters for diagnosing problems. For example, if your application has memory leak issues, you can do the following:
- Trigger GC (Go to /debug/pprof/heap?gc=1 in your browser)
- Download heap data; give the downloaded file name -> file1
- Wait for seconds/minutes.
- Trigger another GC (Go to /debug/pprof/heap?gc=1 in your browser)
- Download another heap of data; give the downloaded file name -> file2
- Compare using the diff_base
go tool pprof -http=:6060 -diff_base file2 file1

Getting Allocation (a sampling of all past memory allocations) profile and Tricks
go tool pprof http://localhost:5555/debug/pprof/allocs
During the allocs profiling, you can do it
- If you saw
bytes.growSlice, you should think about usingsync.Pool. - If you saw your functions, check whether you define fixed capacity in your slice or maps.
Thank you for reading so far 💛. All feedback is welcome 🙏 Special thanks to
for the review and
for encouraging me.
Useful Links
2- Profiling Go Programs by Russ Cox
3- pprof man page
4- GopherCon 2019: Dave Cheney — Two Go Programs, Three Different Profiling Techniques
5- GopherCon 2021: Felix Geisendörfer — Go Profiling and Observability from Scratch
6- GopherConAU 2019 — Alexander Else — Profiling a go service in production